USD/CAD Price Analysis: Bulls running out of steam near 1.3700 key hurdle
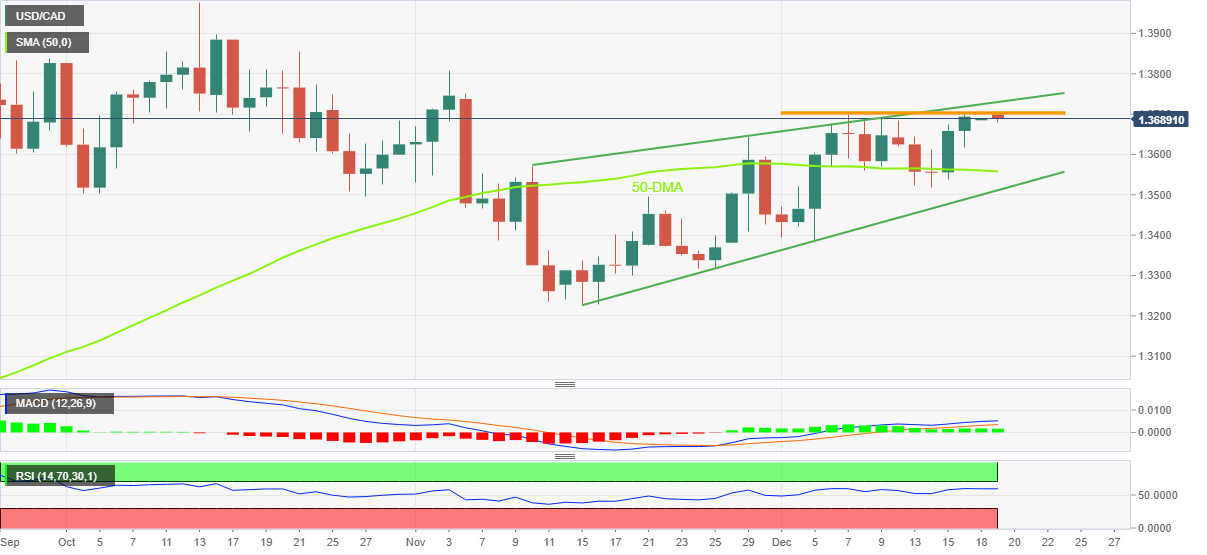
- USD/CAD retreats from six-week high, snaps two-day uptrend.
- Oscillators appear to fade bullish bias of late, rising wedge also doubts upside moves.
- 50-DMA acts as immediate support, 1.3730 adds to the upside filters.
USD/CAD remains depressed around 1.3680 as it struggles to defend the two-day uptrend during Monday’s Asian session.
In doing so, the Loonie pair retreats from a seven-day-old horizontal resistance area inside a rising wedge bearish formation established since early November.
Not only the failure to cross the 1.3700 hurdle but the recent performance of the MACD and RSI (14) also tease the USD/CAD bulls as both the oscillators seem to fade the bullish bias of late.
As a result, a downside towards November’s high of 1.3645 appears imminent. However, the 50-DMA support near 1.3555 will be important to push back the buyers.
Even so, the USD/CAD bears need a clear downside break of the stated rising wedge’s support line, close to 1.3510 by the press time, as well as sustained trading below the 1.3500 round figure, to retake control.
Following that, November’s low near 1.3220 may act as an intermediate halt during the south-run for the theoretical target of the rising wedge confirmation, around 1.3040.
Alternatively, a clear upside break of the 1.3700 hurdle isn’t a warm welcome for the USD/CAD buyers as top-line of the aforementioned wedge, near 1.3730 at the latest, could challenge the Loonie pair’s further advances.
In a case where USD/CAD remains firmer past 1.3730, November’s near 1.3810 could gain the market’s attention.
USD/CAD: Daily chart
Trend: Pullback expected