Silver Price Forecast: XAG/USD takes support near $31, uncertainty is intact ahead of US Inflation
- Silver price finds interim support near $31.00 as US Dollar corrects further.
- The US Dollar comes under pressure after revised estimate for Q1 US GDP showed that the economy grew at a slower pace of 1.3%.
- Silver price could fall on backfoot if it breaks below the psychological support of $30.00.
Silver price (XAG/USD) finds a temporary support near $31.20 in Thursday’s American session after correcting from a weekly high of $32.30. The white metal discovers support after the US Dollar declines further after the United States (US) Department of Labor reported that individuals claiming jobless benefits for the first time for the week ending May 24 were higher at 219K from the estimates of 218K and the former reading of 216K.
Separately, the outcome of a slower US growth rate in the first quarter of the year in the second estimate against preliminary readings has also weighed on the US Dollar. The second estimate for the Q1 real GDP shows that the economy expanded at a slower pace of 1.3% from 1.6% growth recorded in advance estimates.
The US Dollar Index (DXY) has corrected further to 104.76. A downside move in the US Dollar is favorable for dollar-denominated assets such as Silver.
Meanwhile, the uncertainty over the near-term outlook of the Silver price remains intact ahead of the United States core Personal Consumption Expenditure Price Index (PCE) data for April, which will be published on Friday. Annual and monthly core PCE inflation readings are estimated to have grown steadily by 2.8% and 0.3% respectively.
The Federal Reserve’s (Fed) preferred inflation gauge will significantly influence speculation for Fed rate cuts in September. Currently, financial markets expect that the Fed will start reducing interest rates from the last quarter of the year.
Silver technical analysis
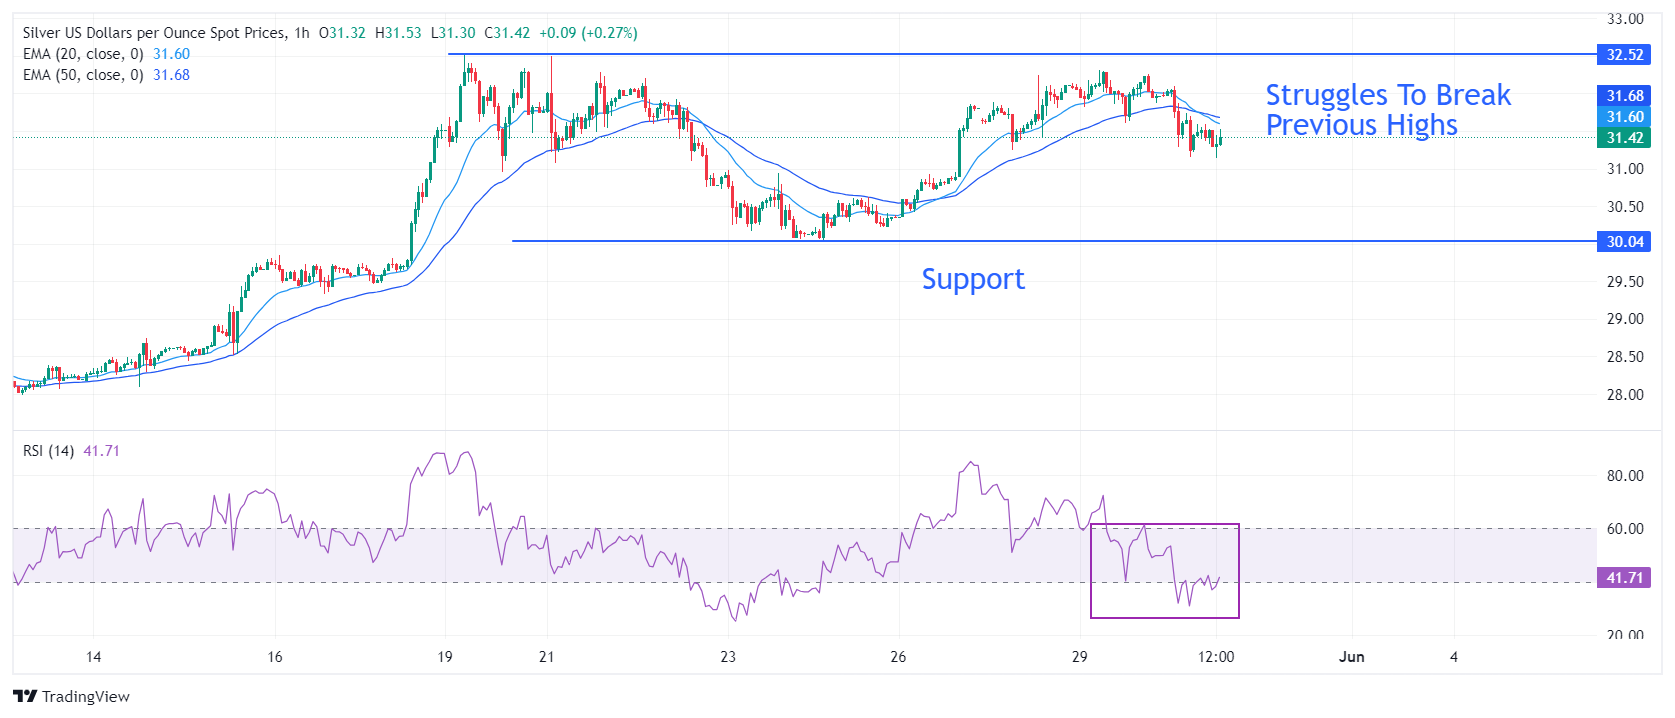
Silver price faces selling pressure while attempting to break previous highs of $32.50. The outlook of the white metal is uncertain as the 20- and 50-period Exponential Moving Averages (EMAs) have delivered a bearish crossover near $31.75.
The 14-period Relative Strength Index (RSI) has shifted into the 20.00-60.00 range from the bullish range of 40.00-80.00.
A breakdown below the horizontal support marked from May 23 low around $30.00 would result in a bearish reversal.
Silver hourly chart

