Back
18 Oct 2019
GBP/USD technical analysis: Sterling ending the week flirting with the 1.3000 handle
- The Cable is breaking to new daily highs to 1.2964 after the London close.
- The level to beat for bulls is the 1.3000 handle.
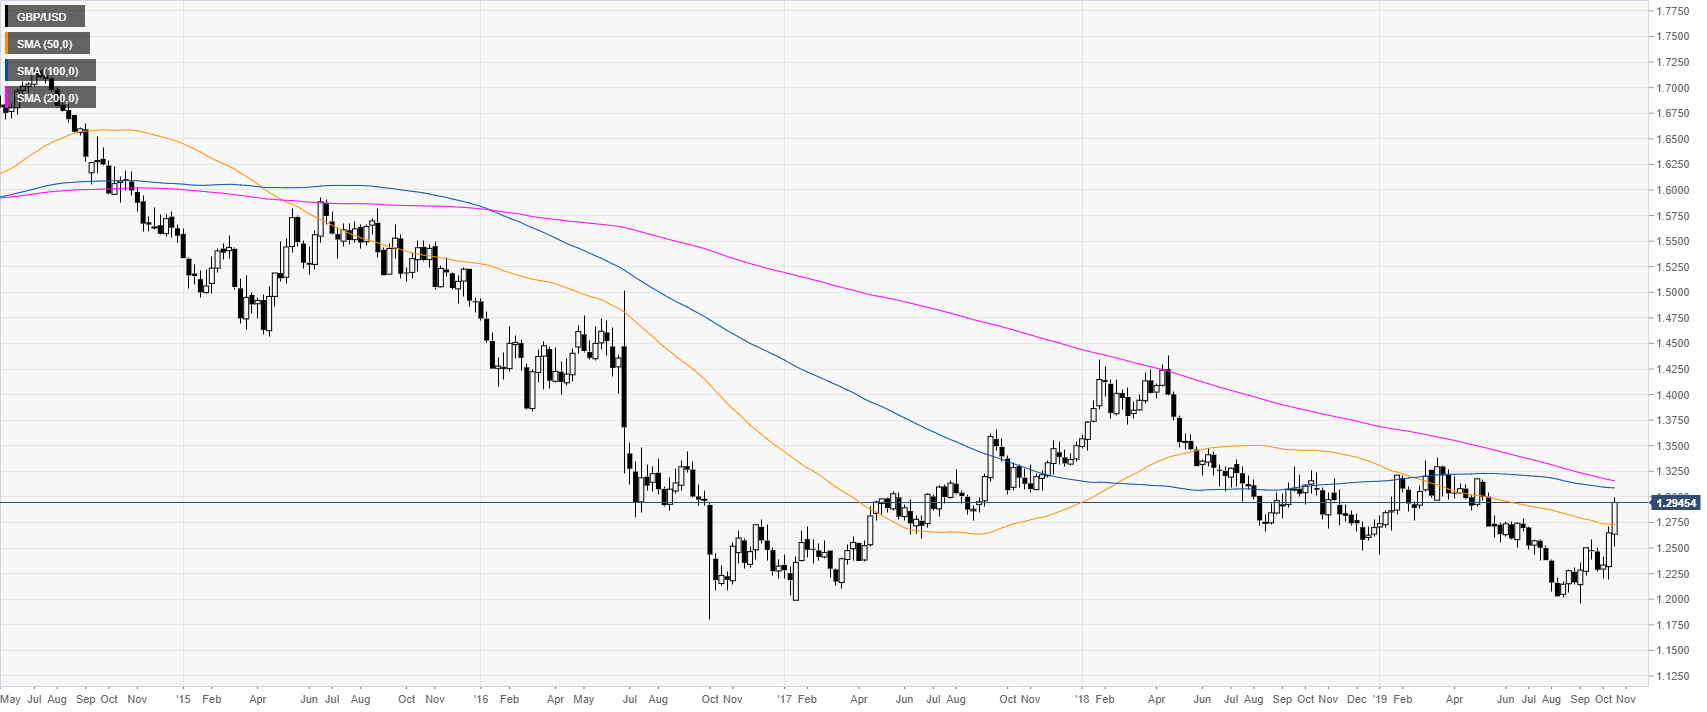
GBP/USD daily chart
The Sterling, on the daily chart, is surging above the main daily simple moving averages (DSMAs). GBP/USD is trading at levels not seen since mid-May 2019.
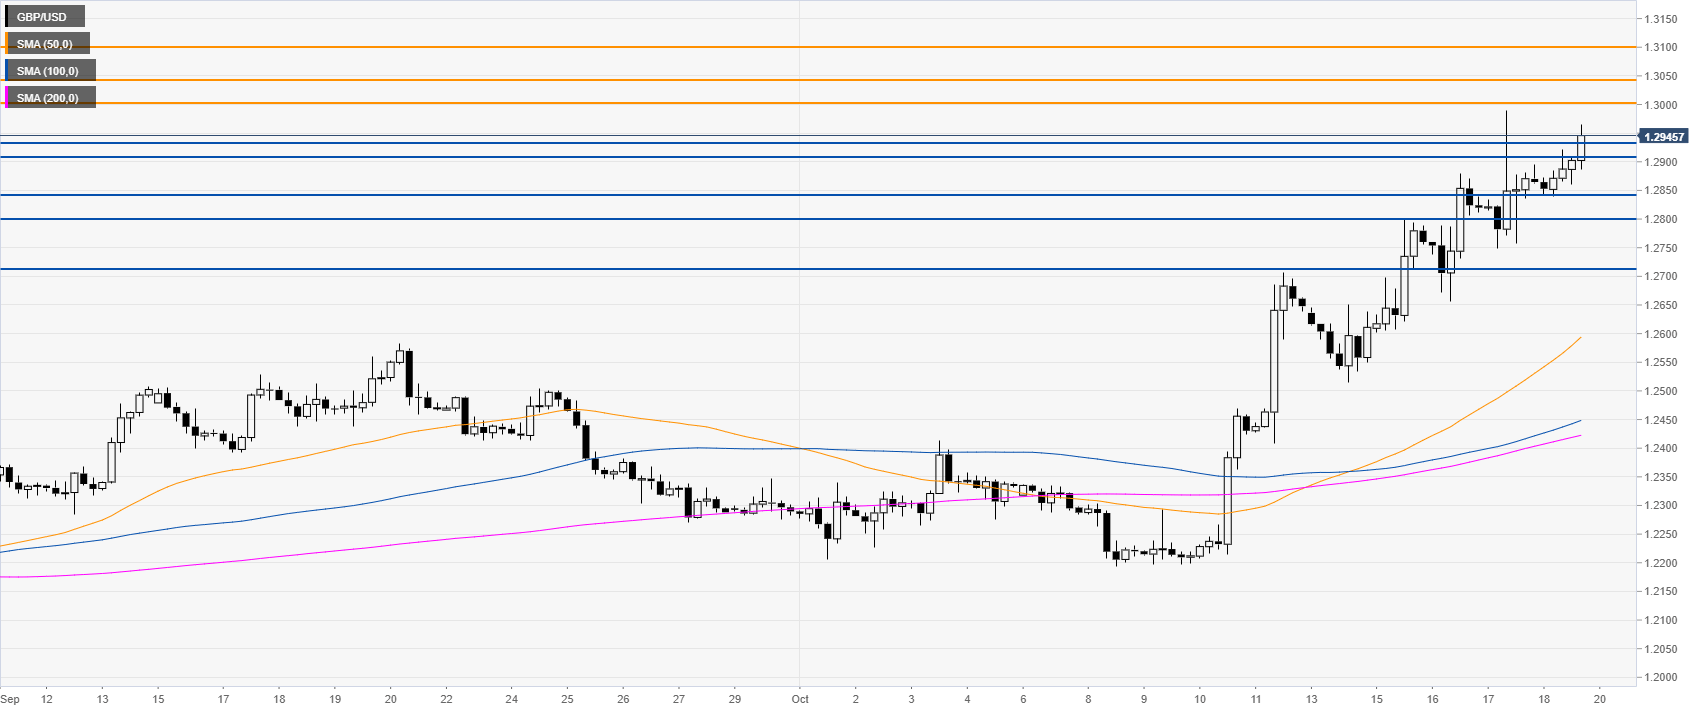
GBP/USD four-hour chart
GBP/USD broke above the 1.2934 resistance as the market is trying to reach the 1.3000 round number. Next week the market will likely try to move beyond this psychological resistance to drive the market towards 1.3043 and the 1.3100 handle.
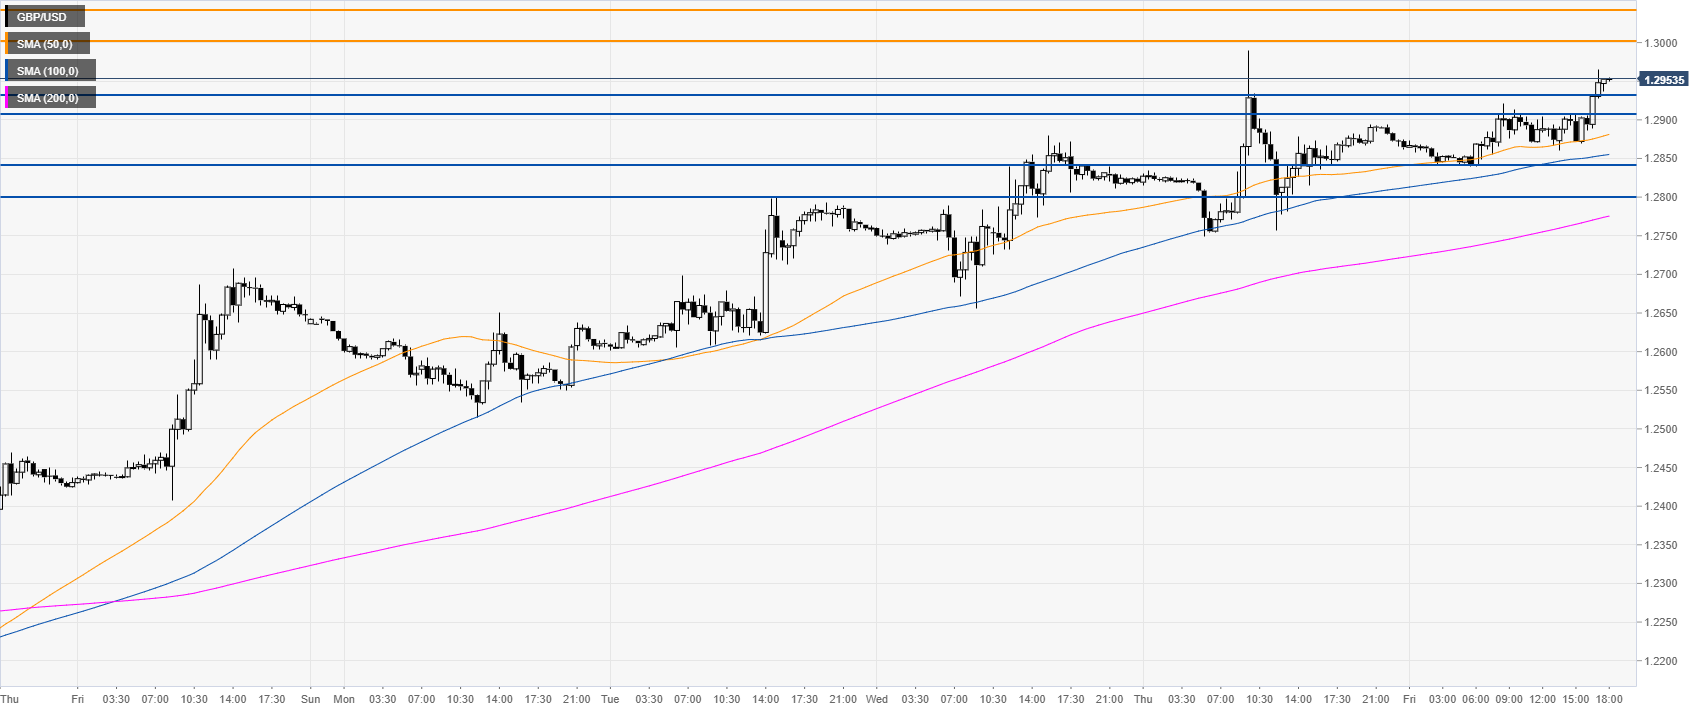
GBP/USD 30-minute chart
GBP/USD is trading above its main SMAs, suggesting bullish momentum in the near term. Support is seen at the 1.2930/1.2908 zone, 1.2842 and 1.2800 price levels, according to the Technical Confluences Indicator.
Additional key levels