Back


22 Oct 2019
GBP/USD technical analysis: Cable trading at daily lows, challenging the 1.2900 figure
- GBP/USD is retracing down from the daily highs, now challenging the 1.2900 handle.
- Brexit headlines are the main Cable drivers.
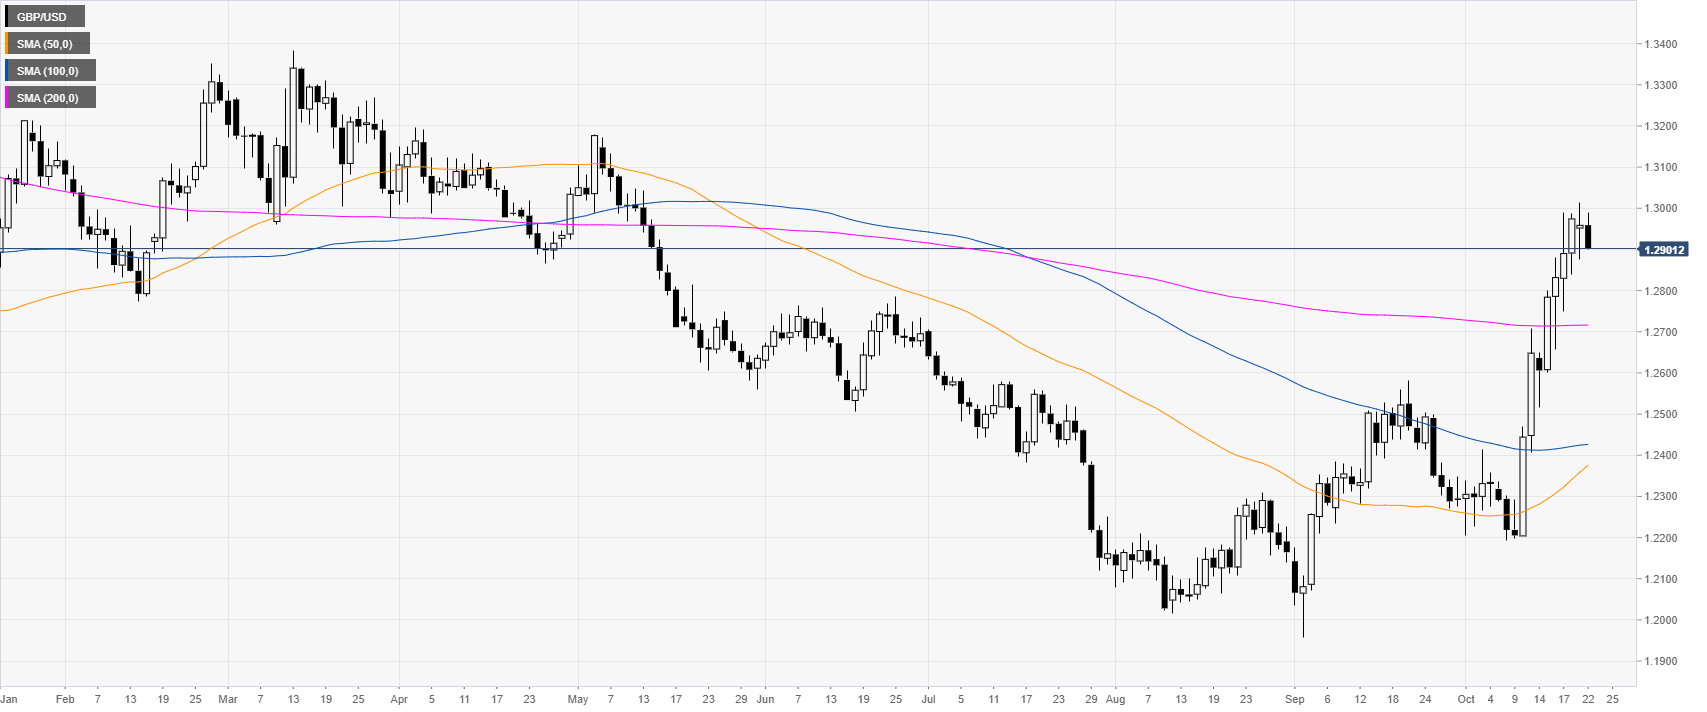
GBP/USD daily chart
The Sterling, on the daily chart, had a spike above the main daily simple moving averages (DSMAs) while reaching levels not seen since mid-May 2019. The Brexit deal optimism fuelled the GBP euphoria of the last weeks.

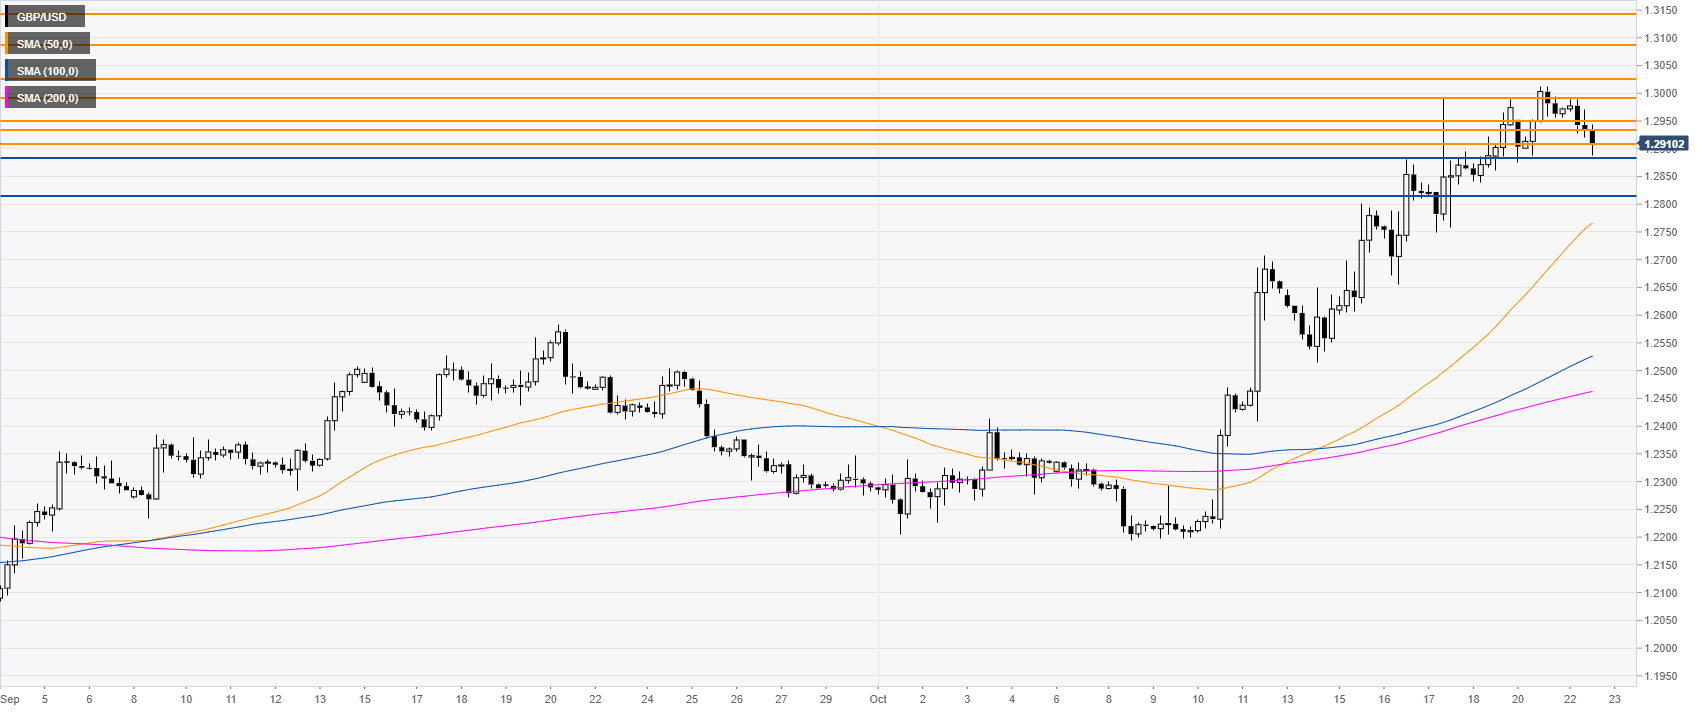
GBP/USD four-hour chart
The Cable is trading in a bull channel above the main SMAs. However, the market is retracing down now, challenging the 1.2881 support level, according to the Technical Confluences Indicator.

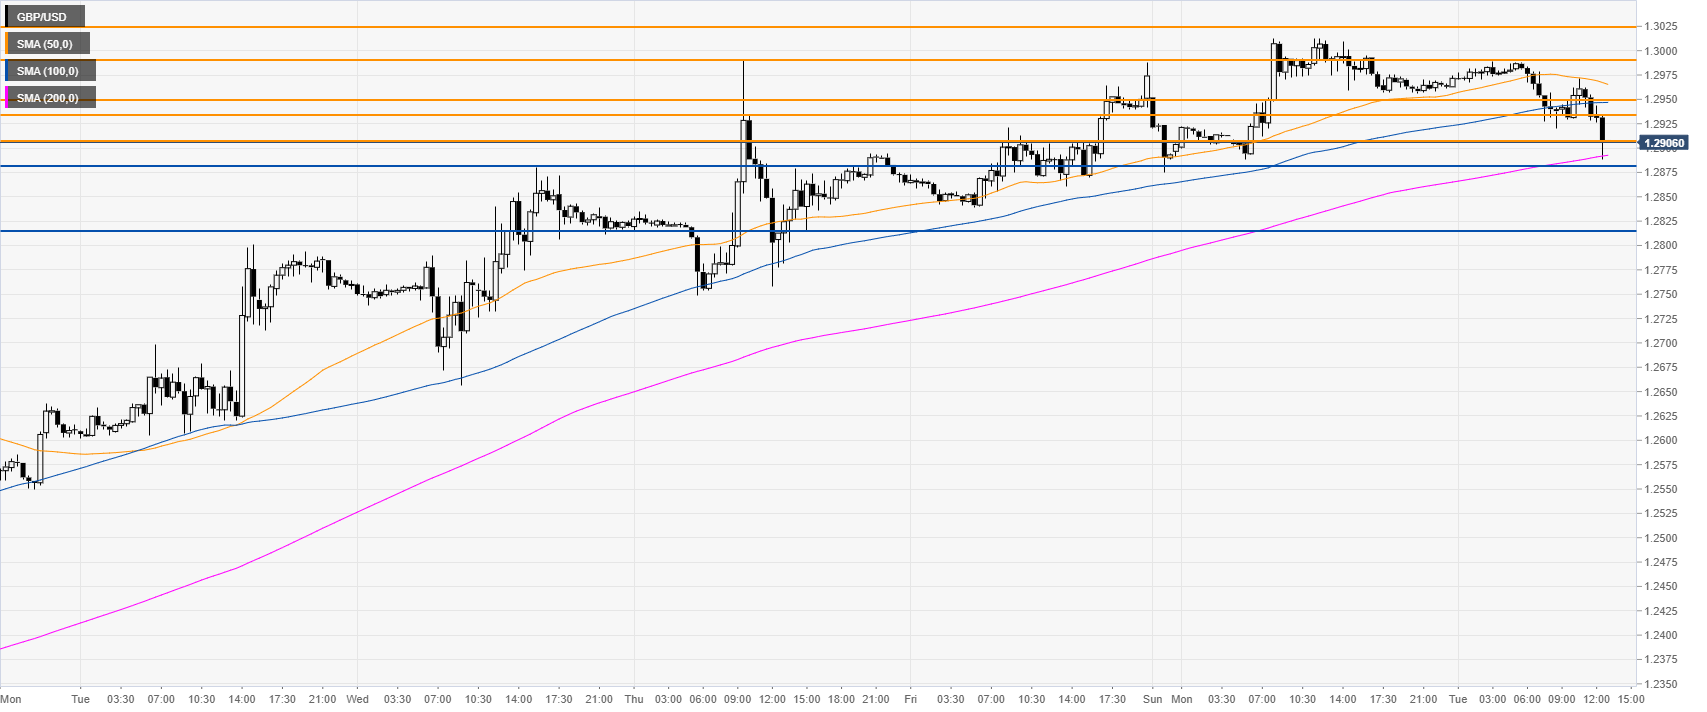
GBP/USD 30-minute chart
GBP/USD is challenging the 200 SMA, suggesting a pullback down in the near term. If bears can break 1.2881, then the market could have a drop towards the 1.2814 level, according to the Technical Confluences Indicator.
On the flip side, if the spot regains the 1.2950 resistance, it can open the doors to a retest of the 1.3000 handle.

Additional key levels
