USD/CAD Technical Analysis: On its way to 1.3340/50 resistance confluence
- USD/CAD trades successfully above 200-day SMA, multi-month-old falling trend line.
- Bullish MACD favors another run-up towards 50% Fibonacci retracement, tops marked since August.
- Three-week-long support line gains sellers' attention below 1.3275.
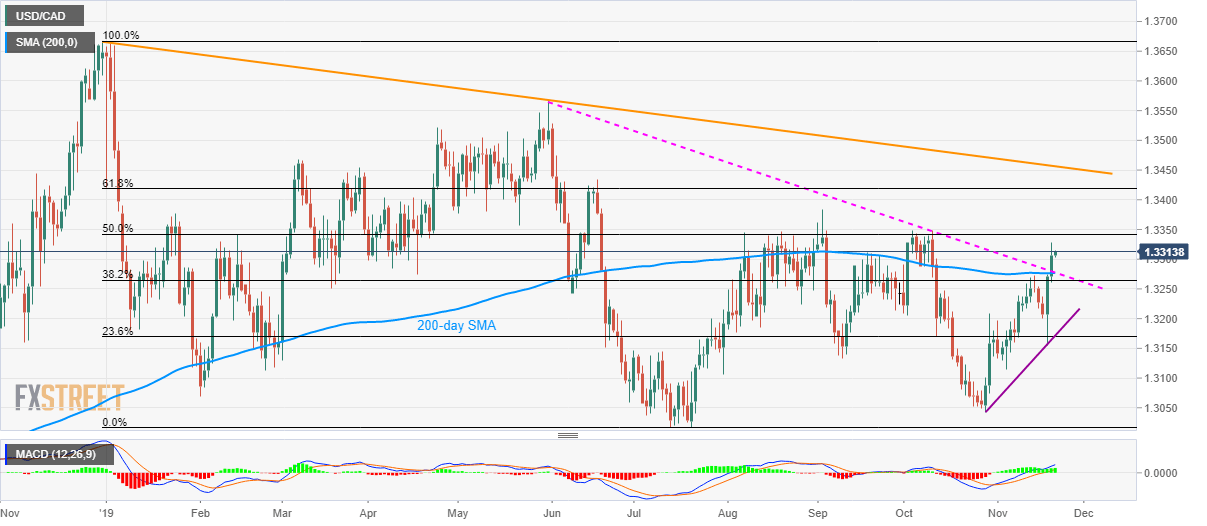
Extending its sustained run-up beyond 200-day SMA and a descending trend line since May-end, USD/CAD is all set to challenge 1.3340/50 supply-zone while taking the bids to 1.3315 during early Thursday.
The Loonie pair’s successful break of the key resistance (now support) pushes buyers towards another upside barrier that comprises multiple highs marked since early-August and 50% Fibonacci retracement of December 2018 to July 2019 downpour, around 1.3340/50.
Also supporting the pair’s rise are bullish signals from 12-bar Moving Average Convergence and Divergence (MACD).
However, September month high near 1.3385 and 61.8% Fibonacci retracement level of 1.3420 become crucial for bulls to conquer ahead of aiming at the yearly resistance-line, at 1.3460 now.
Meanwhile, pair’s declines below 1.3280/75 support confluence, including 200-day Simple Moving Average (SMA) and multi-month-old falling trend line, could recall 1.3200 on the chart whereas a three-week-long rising support line, at 1.3170, could challenge bears afterward.
USD/CAD daily chart
Trend: Bullish