Back

9 Jan 2020
USD/JPY Price Analysis: Greenback runs up and trades near 109.00 handle
- USD/JPY is reversing up strongly trading at its highest since the start of the month.
- The next resistance on the way up is seen at the 109.50 level.
USD/JPY daily chart
USD/JPY is reversing up from the 108.00 handle and the 100-day simple moving average (SMA). The market is above the main simple moving averages (SMAs), suggesting a bullish bias.
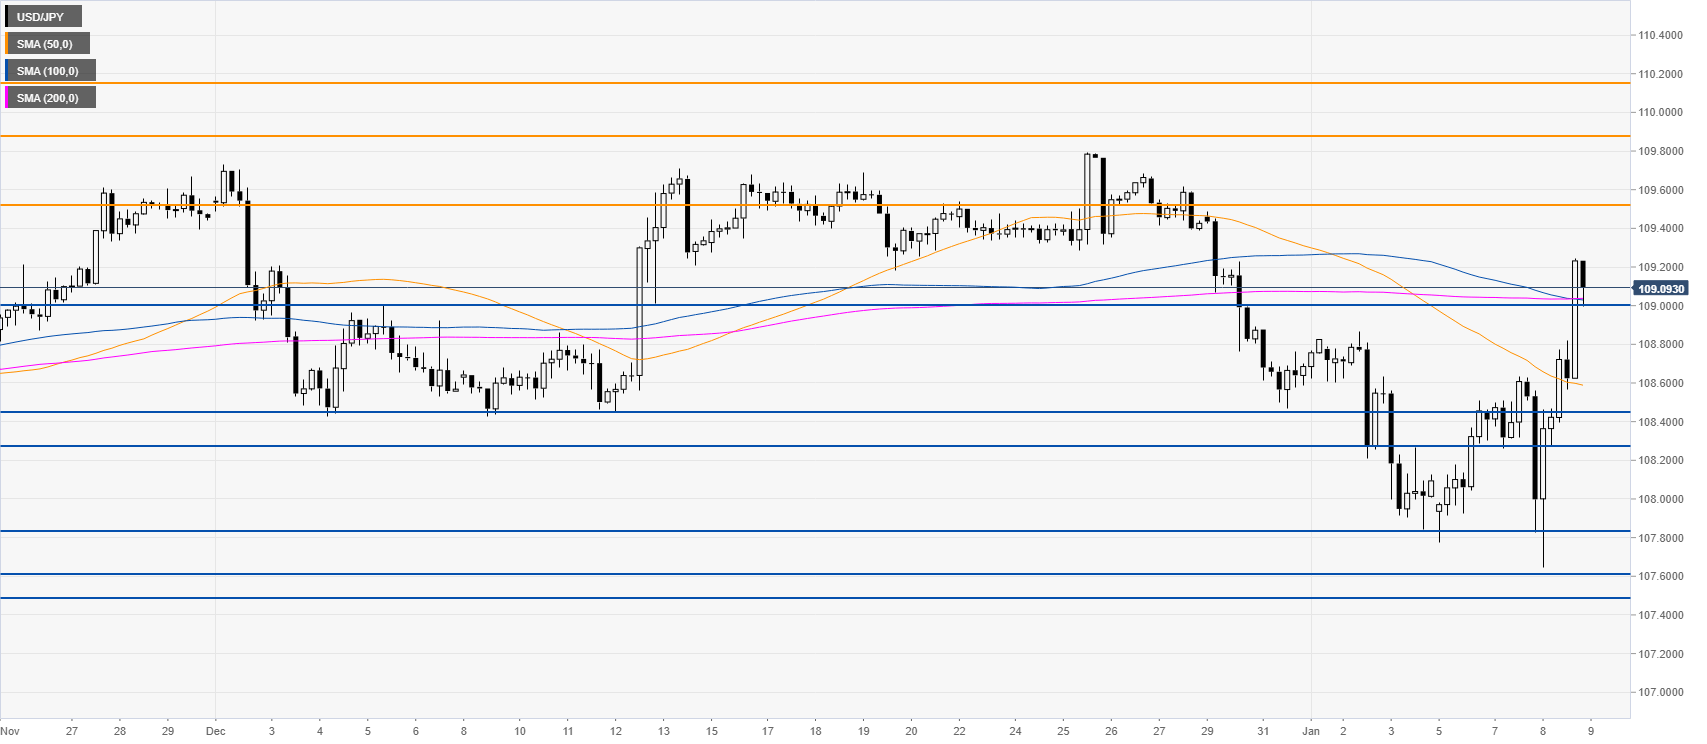
USD/JPY four-hour chart
The spot reached the 109.00 handle and is now finding support just above it and the main SMAs. As the bulls are in control the market can try to push higher towards 109.50 and 109.90 and 110.15 levels, according to the Technical Confluences Indicator. On the flip side, a bear break below the 108.45/28 price zone would be seen as bearish with a potential drop to the 107.83 and 107.61/49 support zone.
Additional key levels