EUR/USD Price Analysis: Prints longest weekly losing run since July
- EUR/USD looks south after registering three-week losing streak.
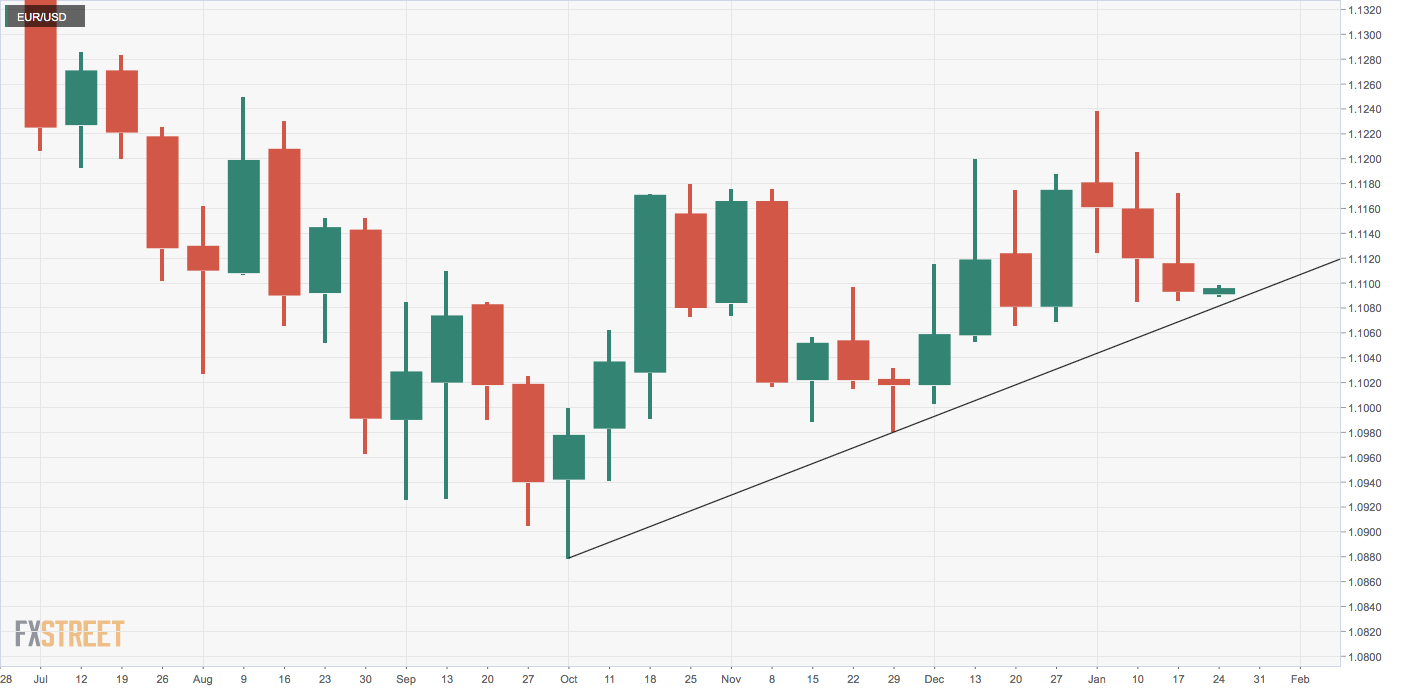
- The pair risks falling to key rising trendline support near 1.1060.
EUR/USD fell 0.30% last week, having registered moderate losses in the preceding two weeks.
The single currency’s three-week losing run is the longest trend of weekly declines since July.
Bears may challenge uptrend line
The long upper shadows attached to the previous three weekly candles is telling a tale of growing bearish momentum – more so, as all candles ended in the red.
Further, the failed bearish channel breakout on the daily chart may be indicative of reversal lower.
The pair, therefore, appears on track to challenge the support at 1.1063 – the support of the trendline connecting lows seen on Oct, 1 and Nov. 29.
The outlook would turn bullish if the trendline support holds ground, fueling a price bounce to levels above the bearish lower of 1.1173 created on Jan. 16.
At press time, EUR/USD is mildly bid near 1.1098.
Weekly chart
Trend: Bearish
Technical levels