Back
30 Mar 2020
Silver Price Analysis: XAG/USD sideways, holding above $14.00/oz
- XAG/USD is reversing up from 2020 lows as the Federal Reserve launched its largest stimulus package in history last week.
- The level to beat for bulls is the 15.00 resistance.
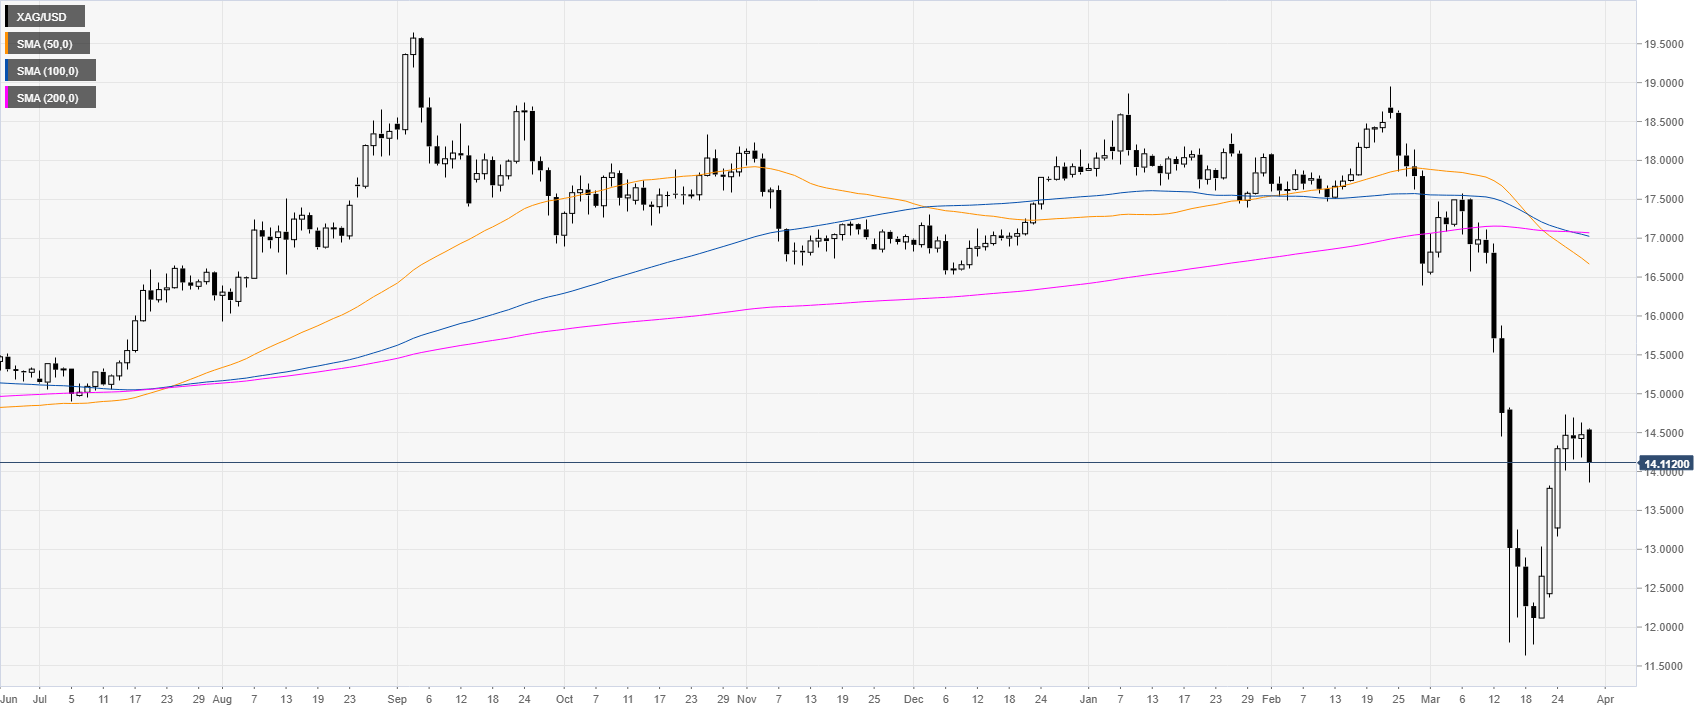
Silver daily chart
After the dramatic selloff to 2009 lows, XAG/USD bounced as the Fed announced unlimited Quantitative Easing (QE) to counter the coronavirus crisis.
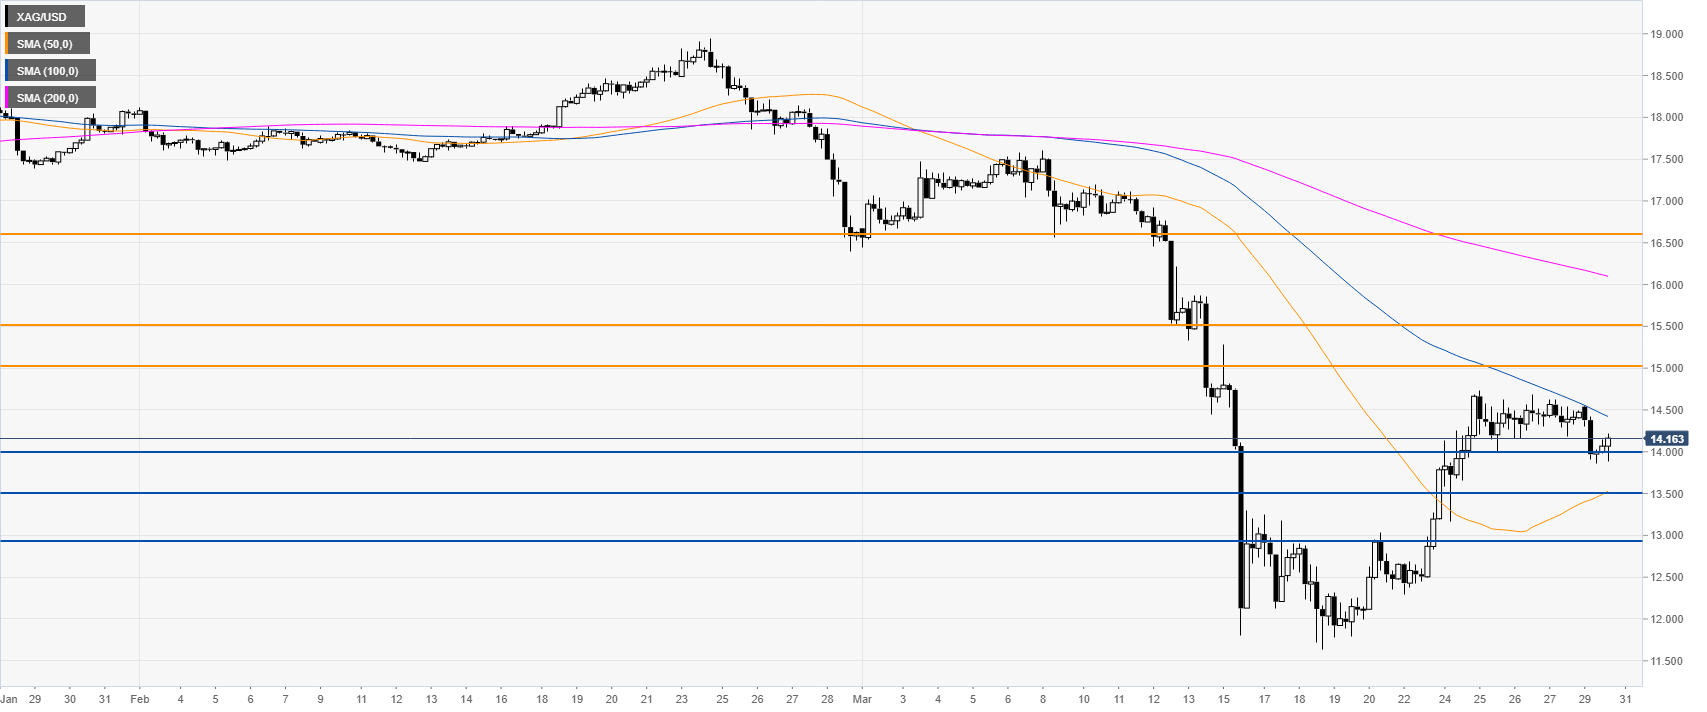
Silver four-hour chart
XAG/USD is consolidating the advance just above the 14.00 support level and the 50 SMA on the four-hour chart. Bulls want a continuation up above the 15.00 handle en route to the 15.50 and 16.60 level on the way up while support can be expected near the 14.00 level.
Resistance: 15.00, 15.50, 16.60
Support: 14.00, 13.50, 13.00
Additional key levels