Gold Price Analysis: Bears challenge $1690 horizontal support
- A strong opening in the US equity markets prompted some fresh selling around gold.
- The downfall once again managed to find some support ahead of the $1690 region.
- The technical set-up warrants some caution before placing fresh directional bets.
Gold failed to capitalize on its intraday recovery move, instead met with some fresh supply near a resistance marked by 100-hour EMA and refreshed daily lows during the early NA session.
A strong opening in the US equity markets weighed on the precious metal's safe-haven status and turned out to be one of the key factors behind the sudden fall over the past hour.
Despite the pullback, the commodity once again managed to find some support near the $1690 horizontal zone, which should now act as a key pivotal point for short-term traders.
Meanwhile, technical indicators on hourly charts have been drifting lower in the bearish territory and support prospects for an eventual break below the mentioned support.
However, oscillators on the daily chart – though have been correcting from higher levels – maintained their positive bias and warrant some caution for aggressive bearish traders.
Hence, it will be prudent to wait for some strong follow-through selling below the mentioned support before positioning for any further near-term depreciating move.
The commodity might then accelerate the slide towards the $1678 intermediate support before eventually falling to last week's swing lows support, around the $1660-59 region.
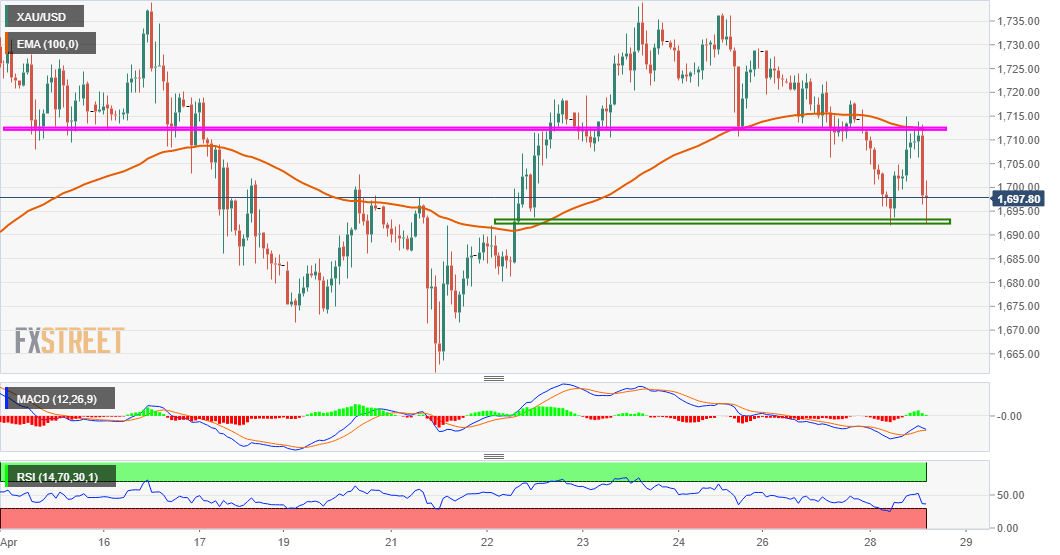
On the flip side, the $1712-14 region might continue to act as an immediate resistance, above which the metal could be headed back towards the $1730 supply zone.
Gold 1-hourly chart
Technical levels to watch