Back
12 May 2020
S&P 500 Asia Price Forecast: US stocks dip into the close
- The S&P 500 bullish correction from mid-March stays intact.
- S&P 500 found support near the 2855 level.
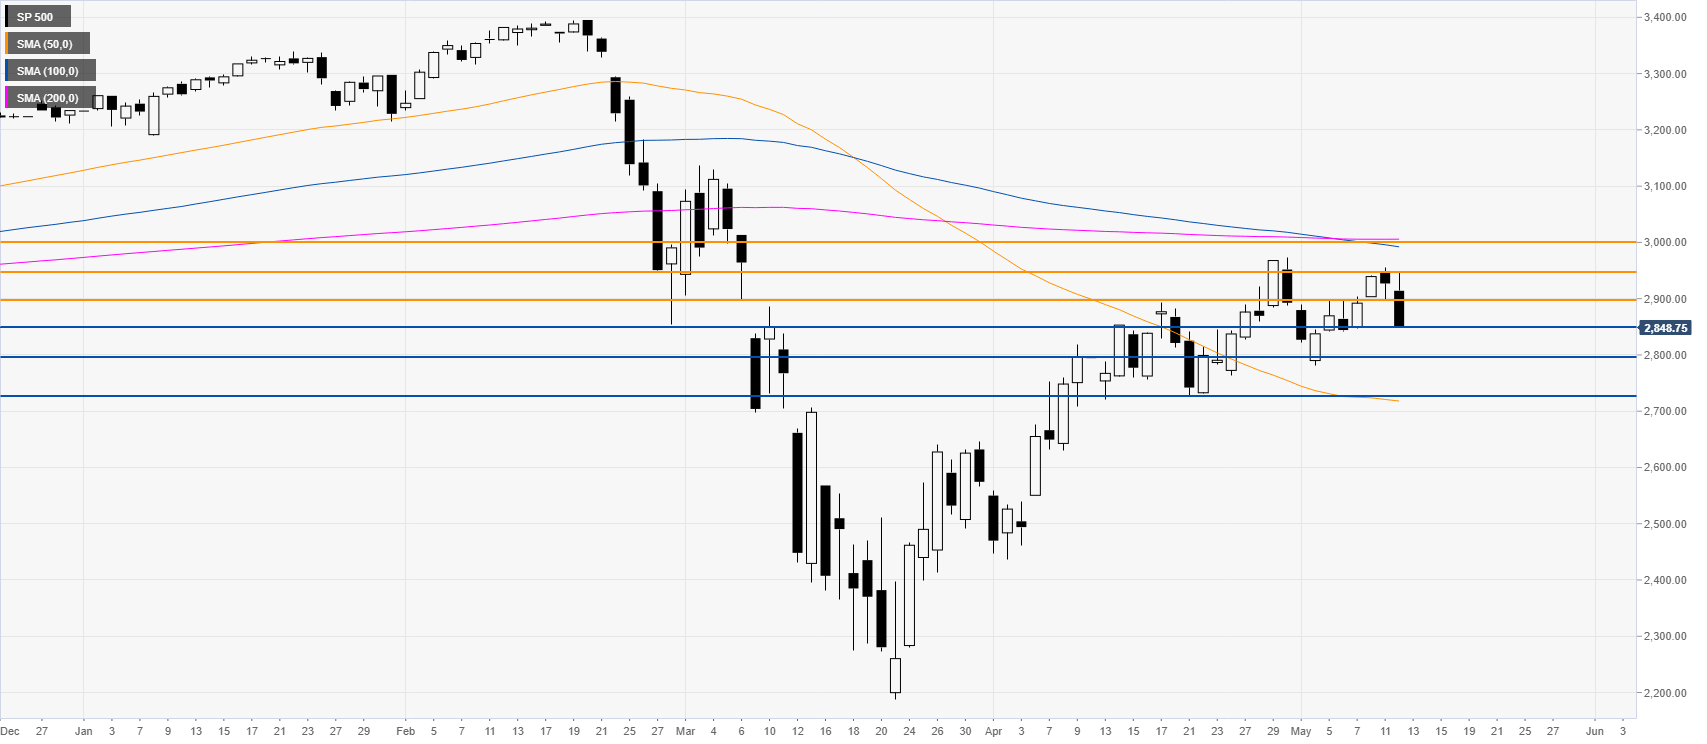
S&P 500 daily chart
After the sharp February-March crash the S&P 500 has been trading in a strong bullish recovery. The market consolidates the advance while near the 2855 support and above the 50 SMA on the daily chart. Despite the dip, buyers are still in control as the S&P 500 is printing higher highs and lows. Bulls should be looking to regains the 2900 resistance en route towards the 2950 level and the 3000 round figure near the 100 and 200 SMAs. Conversely, support is expected to hold near 2855 and 2800 levels.
Additional key levels