AUD/USD Price Analysis: Golden cross on hourly chart points to additional upside
- AUD/USD flirts with weekly tops above 0.7230.
- Dollar dumping remains the main driver for aussie’s advance.
- Technical indicators signal further scope for the upside.
AUD/USD is sitting at weekly highs near 0.7230 region in the European session this Tuesday, benefiting from notable US dollar supply across its main peers.
The aussie shrugs-off the tepid market mood and negative S&P 500 futures amid resurfacing concerns on the Australian-Sino trade front.
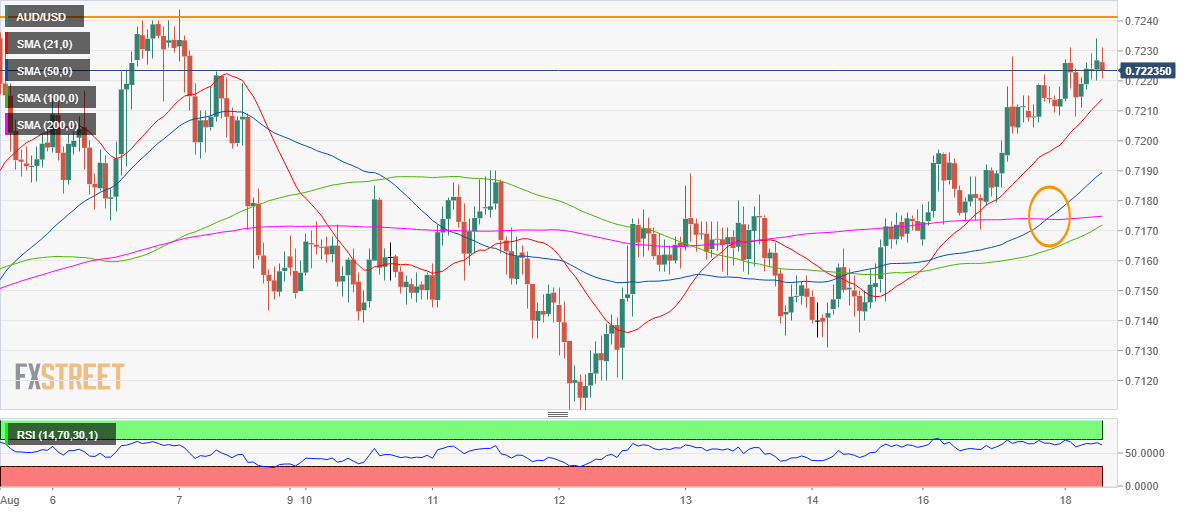
The technical indicators turn in favor of the bulls, suggesting more scope for the upside. The spot will chart out a rounding bottom breakout above 0.7241 horizontal trendline resistance.
The golden cross, 50-hourly Simple Moving Average (HMA) crossing above the 200-HMA, adds credence to the upside bias in the spot.
The next upside target lies at 0.7285, the February 2019 high.
Meanwhile, any pullbacks will find strong support at the bullish 21-HMA at 0.7210, below which the 50-HMA at 0.7189 will be put to test.
All in all, the upside appears more compelling amid bullish hourly Relative Strength Index (RSI), now trading at 65.00.
AUD/USD: Hourly chart
AUD/USD: Additional levels