USD/JPY Price Analysis: Bounces off six-week low towards 133.00 but stays on bear’s radar
- USD/JPY consolidates recent losses around the lowest levels since mid-June, prints four-day downtrend.
- Oversold RSI, key Fibonacci retracement levels challenge bears.
- Bulls need to cross 200-SMA to retake control.
USD/JPY pares intraday losses during the four-day downtrend around 132.55-60. Even so, the yen pair holds onto the bearish breakdown amid Monday’s mid-Asian session.
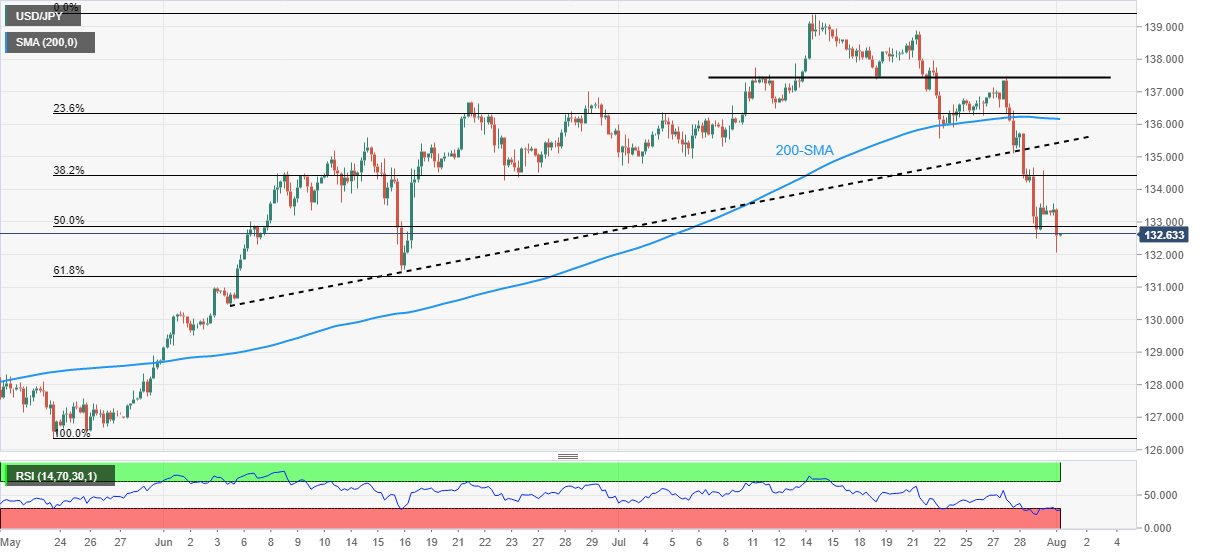
Given the oversold RSI conditions, the quote’s corrective pullback towards the 38.2% Fibonacci retracement (Fibo.) of May 24 to July 14 upside, around 134.40, appears likely.
However, the previous support line from June 06 and the 200-SMA, respectively near 135.45 and 136.20, could challenge the USD/JPY buyers afterward.
It’s worth noting that a three-week-old horizontal resistance area near 137.45-50 appears the last defense for USD/JPY bears.
Meanwhile, the pair’s further downside could aim for the 50% and the 61.8% Fibonacci retracement support levels, around 132.85 and 131.30 in that order.
If at all the USD/JPY prices fail to rebound from 131.30, the 130.00 threshold could act as the additional filter to the south before directing the pair towards May’s low around 126.35.
Overall, USD/JPY remains bearish but a short-term corrective pullback can’t be ruled out.
USD/JPY: Four-hour chart
Trend: Bearish