Gold Price Forecast: XAU/USD gearing up for a fresh upswing to $1,712 – Confluence Detector
- Gold price is treading water at around $1,700 amid weaker US dollar, yields.
- The metal is biding time before the next push higher.
- XAU/USD looks to $1,712 resistance on buying resurgence.
Gold price is consolidating Monday’s staggering rally, as it broke out of the range trade and briefly recaptured the $1,700 barrier. The US dollar remains on the backfoot amid an extended risk-on rally in the global stocks, with the US S&P 500 futures sharply higher so far this Tuesday. Although the US Treasury yields are struggling to find any demand, leaving the bright metal yearning for a fresh catalyst to extend the previous northward trajectory. The greenback remains weighed down by a miss on the US ISM Manufacturing PMI and the optimism on the global market. Looking ahead, bullion traders will gauge whether the dollar correction will continue ahead of the second-tier US economic releases and the Fedspeak. The RBA’s unexpected 25 bps rate hike announcement seems to have limited relevance for gold buyers.
Also read: Gold’s rally – A whole lot of nothing
Gold Price: Key levels to watch
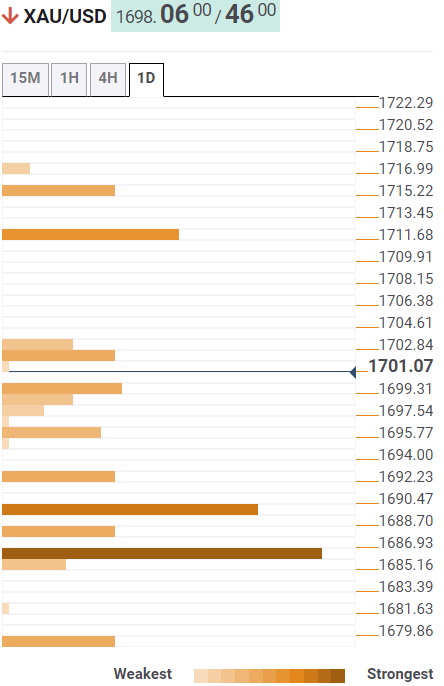
The Technical Confluence Detector shows that the gold price is eyeing a sustained move above the previous day’s high of $1,702 to kickstart a fresh upswing towards the pivot point one-week R2 at $1,712.
The next critical resistance is aligned at the pivot point one-day R1 at $1,715.
On the flip side, strong support is seen at $1,696, below which the Fibonacci 23.6% one-day could come to buyers’ rescue.
Sellers will then aim for the Fibonacci 61.8% one-month at $1,689, followed by the next downside cushion at $1,687. That level is the convergence of the Fibonacci 38.2% one-day, SMA5 four-hour and pivot point one-week R1.
Here is how it looks on the tool
About Technical Confluences Detector
The TCD (Technical Confluences Detector) is a tool to locate and point out those price levels where there is a congestion of indicators, moving averages, Fibonacci levels, Pivot Points, etc. If you are a short-term trader, you will find entry points for counter-trend strategies and hunt a few points at a time. If you are a medium-to-long-term trader, this tool will allow you to know in advance the price levels where a medium-to-long-term trend may stop and rest, where to unwind positions, or where to increase your position size.